The JH String Filter Project - Analysis

As the only information I can find about Jürgen Haible's string filter design are a couple of simulation plots he
did during design, I decided to borrow an FFT analyser from work and set about doing a few plots of its response
in various modes; how does it compare with his predictions? Had I realised how long this was going to take, I
would have probably never started!
Bearing in mind that my version has the 'standard' outputs, individual outputs and an integral 40 channel mixer for
all 40 bands; and that there is going to be some interactions here; there are a *LOT* of permutations!
The set-up I used was a single sine from an EMS Synthi'A', using VCO3 with a saw output of around 40 seconds
period to sweep through the audio spectum. This was fed into the filter and it's output was taken into the FFT
analyser, a Data Physics SignalCalc ACE PCMCIA card on a laptop computer. The plot was set for log axes and the
signal chain was adjusted to give a good signal strength into the filter without overloading the analyser.
I found that a log frequency axis gave very poor resolution for low frequencies, as the FFT bins have a linear
spacing, a single bin covering around 10Hz.
I ended up taking two plots for some readings in order to achieve a better low-end resolution:-
for 10Hz to 20kHz range, FFT uses 1200 lines, averaging up to 5000 readings,
for 10Hz to 1kHz range, FFT uses 800 lines, averaging up to 500 readings.
All other settings (FFT and signal chain) remain untouched.
In order to show multiple trend lines superimposed on a single graph, the following images have all been manipulated in Adobe PhotoShop by a good freind, Dean Smith (available for contract Web design work, graphics design and image manipulation)!
OK, enough waffle, let's see what I got.
Firstly, the raw, swept sine, directly into the FFT card. The three trends shown are:-
Upper brown: Synthi swept sine, FFT running 10Hz to 20kHz
Mid red : Synthi swept sine, FFT running 10Hz to 1kHz
Lower brown: SignalCalc ACE internal signal generator, FFT running 10Hz to 20kHz
Despite the latter being the flattest trend, I failed to get enough signal to adequately drive the string filter.
First test is simply the 'standard' output, resonance set to minimum and stereo spread at minimum in order to allow a single, mono reading.
In common with a lot of these plots, the 10Hz to 1kHz trend seems to disagree with the 10Hz to 20kHz trend where I expected them to overlap at around 1kHz! I can't find a good excuse for this so I simply present what I have and leave it to the reader to persue or ignore this 'feature'.
The two plots can be seen to broadly agree in shape from around 330Hz to 1kHz, the additional detail for low frequencies being given by the 10Hz to 1kHz plot
The same but with resonance at maximum (this is a subjective setting, I am avoiding feedback 'howl', which is quite possible if you wish)
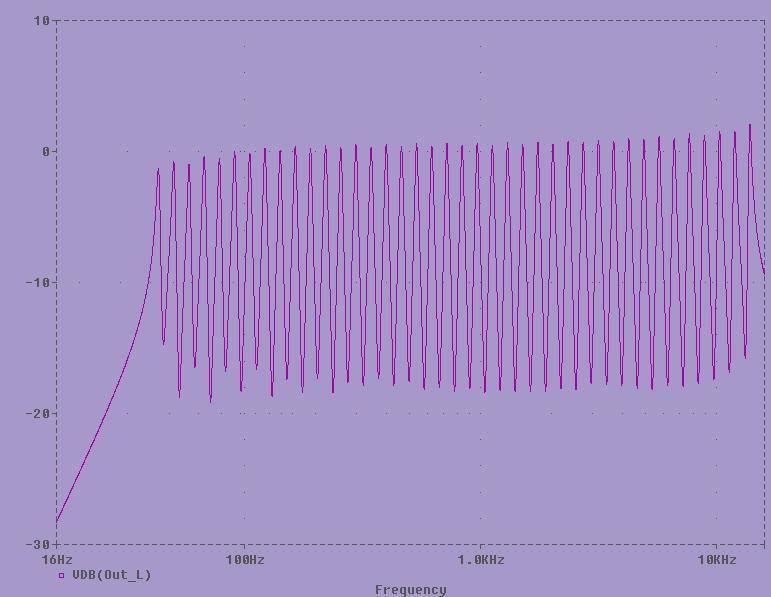
In my build, I can deselect any or all 4 'partials', here, only partial 1 is selected, with minimum resonance.
Note that only every fourth peak is now enabled, the peaks are considerably larger.
The lowest peak in this partial is around 58Hz.
Partial 2 in isolation. The lowest peak is around 43Hz.
Partial 3 in isolation. The lowest peak is around 67Hz.
Partial 4 in isolation. The lowest peak is around 50Hz.
Faders: (all partials selected for main output)
Minimum resonance, 43.47Hz fader full up (lowest frequency), all others at zero
Socket and Fader: partials 1, 3 and 4 selected for main output
Minimum resonance, 43.47Hz socket (lowest frequency)
Fader for 43.47Hz full up, all others at zero.
This seems to indicate some DC on the socket output, but otherwise the two are identical.
A family of curves for the 463.2Hz filter socket (broken down in following curves).
The 463.2Hz filter socket, all partials deselected.
Blue : minimum resonance.
Violet: medium resonance.
Red : maximum resonance (some 50Hz mains hum visible).
The 463.2Hz filter socket, minimum resonance.
Blue : all partials DESELECTED.
Brown: only partial 1 selected.
Green : partials 1, 3 and 4 selected.
The 463.2Hz filter socket, medium resonance.
Blue: all partials DESELECTED.
Red: partial 1 only selected.
The 463.2Hz filter socket, maximum resonance.
Red: all partials DESELECTED.
Green: partial 1 only selected.
Blue: partial 2 only selected (this frequency is included in this partial group).
So, to compare my findings with the simulation from Jürgen's write-up, I think that, allowing for my less than ideal set-up (the swept sine is not a constant amplitude), and that my circuit is built from real-world components with tolerance variations; my plot agrees with the simulation plot (from his website, with his permission) fairly well.
Observations I made during this analysis include:-
1/ I was initially surprised how the resonance setting and partial selection affects the fader and socket outputs. It is obvious that this feedback will cause this; I just never thought about it until it hit me in the face on these plots!
2/ As a consequence of the above feedback, using the filter's individual frequency outputs could be more interesting than I expected.
3/ Another way of controlling resonance for a single frequency output would be to create an external feedback loop, this would prevent other frequency peaks being superimposed on the output, but means the vast majority of the filters are rendered unavailable; maybe one filter every couple of octaves could be used simultaneously this way.
4/ The resonance control appears to be able to 'invert' the feedback!
At minimum resonance, the plots show 'negative' peaks.
As the resonance is increased these peaks become positive.
If you would like to correct any of my assumptions here, email me at alan@sonicsheep dot com
LINKS :-
Return to the filter construction page »
Return to the front page »
|
